AI-powered vegetation management software for utility power lines
    AI-Powered Platform

    Vegetation Management Software for Electric Utilities — From $299/Month

    Scan your whole network in minutes and get high-risk segments grouped into routable work zones — not a spreadsheet of coordinates. Satellite AI, correctly scoped FAC-003-4 inspection support, and on-demand reports from $299/month.

    Free plan available • No credit card required • Cancel anytime

    $299/mo
    Flat rate, up to 500 miles
    Minutes
    First report, not weeks
    Work zones
    Segments grouped into locations

    Built by a utility GIS professional for utility vegetation managers

    Minutes
    First report
    $299
    Per month
    Sentinel-2
    Imagery source
    R6
    Subject transmission support

    What is Vegetation Management Software for Electric Utilities?

    Vegetation management software helps electric utilities screen vegetation near power lines, support scoped NERC FAC-003-4 inspection support, prioritise field crew work, and reduce vegetation-related outages. Modern utility vegetation management software uses satellite imagery, AI risk ranking, and automated documentation to narrow where manual inspection and LiDAR survey effort is spent.

    Electric utilities, municipal power providers, and electric cooperatives use it to:

    • Screen entire power line networks in minutes instead of weeks
    • Generate NERC FAC-003-4 vegetation clearance requirements and applicability
    • Rank corridors by vegetation density to decide what to inspect first
    • Group high-risk segments into work zones crews can route to
    • Re-run analysis after a storm or after contractor clearing work

    Published industry ranges put manual patrol at roughly $500–$1,500 per mile and LiDAR survey at roughly $2,000–$5,000 per mile (see our LiDAR cost comparison). These are industry ranges, not savings any utility has reported using LineGuard. Satellite satellite monitoring is priced as a flat monthly fee instead, which changes where those per-mile budgets get spent. Also see our comparison of AiDASH alternatives.
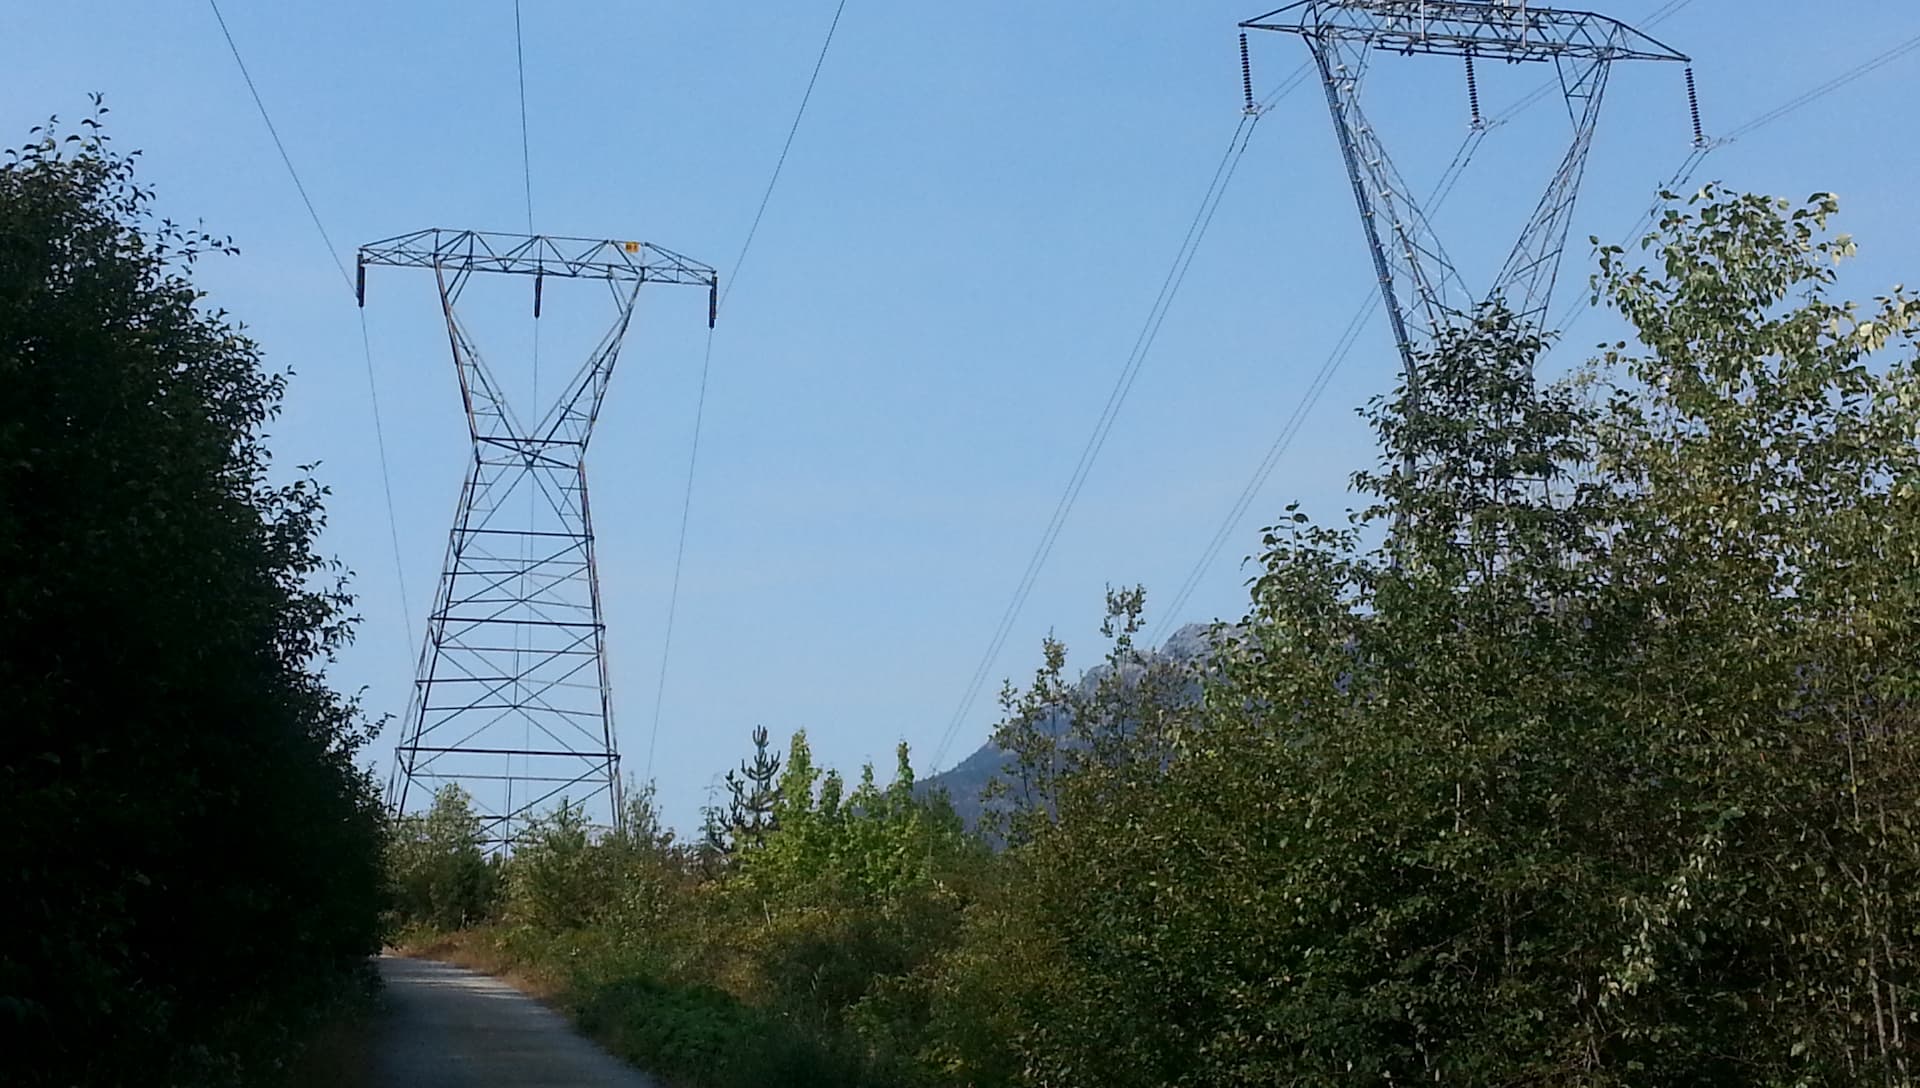
    What the Platform Actually Does

    Satellite screening, density-based risk ranking, work-zone clustering, and date-stamped documentation. Nothing else.

    Satellite NDVI analysis

    Sentinel-2 satellite imagery (10–20 m resolution) measures vegetation density across your entire network. No drones, no helicopters, no per-mile fees.

    AI risk scoring

    Vegetation density along your line corridors is scored and ranked so the highest-density segments surface first. Scoring uses vegetation density only — it is a screening signal, not a clearance measurement.

    Scoped FAC-003-4 inspection support

    For subject transmission, support the annual R6 Vegetation Inspection; for distribution and sub-transmission, create date-stamped screening records for planning and review.

    PDF reports

    Executive summary, colour-coded risk map, and a priority-ranked segment list with GPS coordinates — ready for board meetings and audit files.

    GIS data integration

    Supports Shapefile, GeoJSON, KML, and KMZ, with automatic coordinate system conversion. Upload once, re-run analysis on demand.

    How it works, end to end

    Upload → analysis → work zones and reports → field verification. It fits alongside your existing vegetation management workflow.

    Step 1

    Upload GIS data

    Upload your line network as Shapefile, GeoJSON, KML, or KMZ. Takes a few minutes. Upload once, re-run analysis on demand.

    Step 2

    Analysis runs

    Sentinel-2 imagery and density-based risk scoring cover your entire network. Results in minutes, not weeks.

    Step 3

    Get work zones and reports

    A PDF with ranked segments, work-zone centre coordinates, and date-stamped screening records you can file.

    The difference

    Segments aren't places. Work zones are.

    A network-wide scan returns ranked segments — but segments are not locations. Two segments 25 metres apart are the same span, the same tree, and two rows in a spreadsheet. LineGuard groups high-risk segments within 500 m of each other into work zones, each with centre coordinates and corridor span. On a recent 1,005-segment transmission network, 101 high-risk segments grouped into 40 distinct locations — the difference between a ranked list and a work plan a crew can route to.

    1,005
    Segments scanned
    101
    High-risk segments
    40
    Distinct work zones

    How It Compares: Manual Patrol, LiDAR, and Enterprise Platforms

    Cost figures are published industry ranges for manual patrol and LiDAR survey, not savings reported by any LineGuard user.

    FeatureManualLiDARLineGuard AI
    Cost (industry range)$500–$1,500/mi$2,000–$5,000/mi$299/mo flat
    Speed2–4 weeks2–6 monthsMinutes
    Re-runSchedule crewNew surveyOn demand
    Screening recordsManualConsultantAuto-generated
    Post-stormSchedule crewNew surveyRun immediately
    Work zonesNot applicableNot applicableHigh-risk segments grouped into routable locations

    Software in this market serves two distinct segments. Both draw on the same public satellite data (Sentinel-2) — the difference is pricing model, implementation complexity, and who the product is designed for.

    Enterprise platforms

    • Built for large utilities (10,000+ miles)
    • Custom quoted contracts, typically per-mile
    • Broad feature sets and custom integrations
    • Multi-month implementation timelines
    • Example: AiDASH

    Small-utility tools

    • Built for co-ops and municipal utilities (500–5,000 miles)
    • Flat-rate monthly pricing from $299
    • Core satellite screening and date-stamped documentation
    • Self-service, working in minutes
    • Example: LineGuard

    Choose based on your utility's size, budget, and technical resources. For electric cooperatives and municipal utilities, see how satellite screening supports 138kV clearance requirements without enterprise complexity.

    Where Utilities Use It, and How Your Data Is Handled

    Annual R6 inspection support

    For transmission subject to FAC-003-4, generate date-stamped satellite screening records supporting the annual Vegetation Inspection under R6.

    View Compliance Features →

    Electric cooperatives

    Satellite screening at co-op pricing ($299/mo). Self-service platform for small teams. Flat-rate pricing for rural service areas.

    See Co-Op Solution →

    Storm damage assessment

    Run an analysis immediately after a storm to see which corridors changed, then send crews to those locations.

    Learn More →

    Security and data privacy

    Data is encrypted in transit and at rest

    Your GIS data stays on our servers — it is never sold or shared

    Access is restricted to your own account's uploads and reports

    Reports are downloaded through short-lived, ownership-checked links

    Vegetation Management Software FAQ

    What is the best vegetation management software for small utilities?

    For small utilities and electric cooperatives managing 500–5,000 miles, the most useful option provides satellite screening, date-stamped records, and flat-rate pricing. LineGuard is purpose-built for this market at $299/month with self-service setup, on-demand reports, and no IT staff required.

    How does vegetation management software reduce costs?

    Published industry ranges put manual patrol at roughly $500–$1,500 per mile and LiDAR survey at roughly $2,000–$5,000 per mile. Satellite screening is a flat monthly fee regardless of network size, so it can be used as a first pass to narrow where those higher-cost methods are applied. LineGuard is $299/month ($3,588/year) with no per-mile fees. Those ranges are industry figures, not savings any utility has reported using LineGuard.

    Is vegetation management software worth it for electric cooperatives?

    It depends on how you use it. At $299/month flat rate, a small co-op team gets a network-wide screening pass, work zones their crews can route to, and date-stamped documentation without per-mile fees or consultants. It does not replace field inspection — it tells you which corridors to inspect first.

    What makes LineGuard different from other vegetation management software?

    Work zones. Most tools return a ranked list of segments, but segments are not locations — two segments 25 metres apart are the same span and the same tree. LineGuard groups high-risk segments within 500 m of each other into work zones with centre coordinates and corridor span, so what you get is a routable work plan rather than a spreadsheet. Beyond that: flat $299/month, self-service setup in minutes, and date-stamped reports.

    How does vegetation management software help with NERC FAC-003-4 compliance?

    For transmission subject to NERC FAC-003-4, LineGuard supports the annual Vegetation Inspection required under R6, which the standard permits to use satellite imagery. For distribution and sub-transmission, which fall outside NERC's scope, reports provide date-stamped records of systematic vegetation screening for maintenance planning and regulatory or board review.

    What GIS data formats does vegetation management software support?

    LineGuard supports Shapefile (.shp), GeoJSON, KML, and KMZ, with automatic coordinate system conversion. Upload your transmission and distribution line centrelines once and re-run analysis whenever you need it. Most utilities can export this from their existing GIS in a few minutes. No GIS expertise required.

    Does vegetation management software replace field crews?

    No. Satellite screening is a network-wide first pass that shows where crews should look first. Crews still validate conditions on the ground and do the clearing work — the analysis just tells them where to start.

    Can I try it before committing?

    Yes. LineGuard offers a free plan with no credit card required. Upload your GIS data, run your first network analysis, and generate a date-stamped screening report. Analysis time scales with network size — results arrive in minutes, not weeks. Month-to-month, cancel anytime.

    Start at $299/Month

    On-demand vegetation risk screening, work zones with coordinates, and date-stamped records for planning and review. Free plan available.

    No credit card required • Month-to-month • Cancel anytime

    Ready to See Your Network as Work Zones?

    Start Free